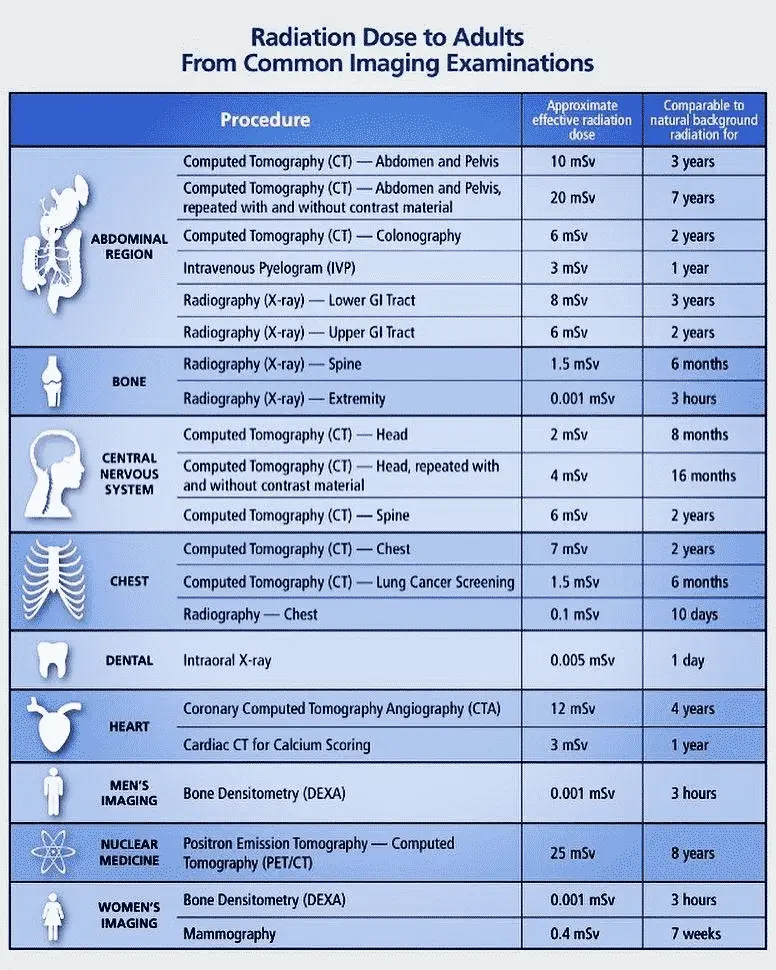
Radiation dose charts are commonly used to see how much radiation a person gets from different radiology examinations.
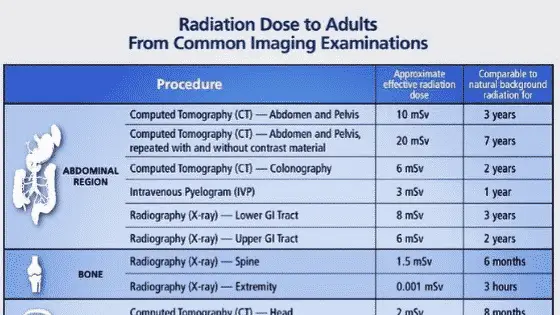
This is a common radiation dose comparison chart. It shows the approximate effective radiation dose in comparison to natural background radiation in months/years.
If you need a radiation dose chart for your work, you are welcome to save and print this one. Or bookmark this page so you can refer back to it when needed.

To save this radiation dose chart for personal use, follow these instructions:
- Right click on the radiation dose chart above
- Click “Save As” or “Save Image As”
- Choose the location you want to save the image
- Give the image a name like Radiation Dose Chart
- Click SAVE
This is a very handy chart for when patients ask about radiation dose. Use it when they ask how much radiation they are getting from their exam.
Patient: “How much radiation am I getting from my Chest Xray today?”
Technologist: “About 0.1 mSv, which is the same you would get from background radiation if you were to be outside for ten days.”
Then politely tell them “…but stay away from those Nuc Med studies…”
🙂 – I’m kidding, of course!

