What is a Radiography Technique Chart for Rad Techs?
- A standard Radiography technique chart is a written table that contains the following technical data to help radiographers obtain a consistent, standardized image while using the lowest radiation dose possible:
- The body part imaged (hand, foot, skull, etc)
- The kV or kilovolts required for the image (how strong of a beam)
- The mAs or milliamperes per second (how long the beam emits)
- Whether or not a grid is used (helps filter out scattered energy)
- An “S” value or Sensitivity value (a key quality indicator)
For a portable technique chart, you can take with you, visit this link.
To download a copy of my printable radiography techniques chart template, please visit this page.
This particular template can be considered a universal radiography technique chart as well as a standard digital radiographic technique chart.
Below is a video representation of this article:
What is the purpose of a radiography techniques chart?
- To list the exam parameters needed to obtain an optimal x-ray image, including kVp, mAs, SID, body part and patient size.
This chart is vital in the medical imaging field. you can use it to image animals in a veterinary setting and humans in a medical setting.
So, what is a technique chart?
It is basically a list of data that contains radiographic examination parameters used during the acquisition of an image.
When a radiographer performs an x-ray examination on a patient, they have to set specific parameters on the x-ray equipment.

For instance, if you injure your leg in an accident and a doctor wants to know if you broke your leg, you need to examine it with an x-ray.
Hence, By getting an x-ray image, the doctor can see all the bones of the leg and determine if it is truly broken or not.
A broken bone is called a fracture and could need medical treatment.
The chart contains all the different parameters or technical factors that the radiographer needs to capture a diagnostic image.
Having a chart containing established technical parameters prevents technologists from the need to stop and calculate all of the components needed for a high-quality image by hand with each exposure.
So, This is a great tool for pediatric chest x-ray technique charts. It also works for a suitable portable x ray techniques chart.
What is the importance of radiographic image quality?
- An image produced resulting in nondiagnostic quality is useless to a radiologist. Poor image quality often requires a repeat of this image, giving the patient more radiation dose.
It is important that the image is of diagnostic quality. Inappropriate use of technical parameters while capturing an x-ray image could render the image completely useless.
Or worse, it could hide the underlying problem by not properly identifying it. This could worsen a patient’s condition over time because you can’t identify the problem.
Moreover, In these cases, repeat the X-ray to capture a better image. But every repeat image gives the patient more radiation, which we want to avoid.
That is why having a technique chart on the wall can help to choose the right technical factors to get the X-ray image done right the first time.
These x-ray technique charts are good for any body part. It also helps technologists abide by one of their fundamental underlying directives, ALARA. This stands for As Low As Reasonably Achievable.
It directs us to capture images while using the lowest dose of radiation possible but still obtains a diagnostic image.
What is on the X-ray techniques chart?
A standard technique chart contains several different pieces of information:
- Object to be imaged – It lists the body part or parts to be examined, like a skull, hand or foot.
- Beam strength – The chart records the X-ray energy in kilovolts peak (kVp) that should be used during image capture. The kVp is the strength of the energy beam that is directed at the object being imaged.
- Beam exposure time – The chart also contains a place to designate exposure time in milliamperes per second (mAs). The mAs are what tells the X-ray machine the length of time to emit the radiation beam.
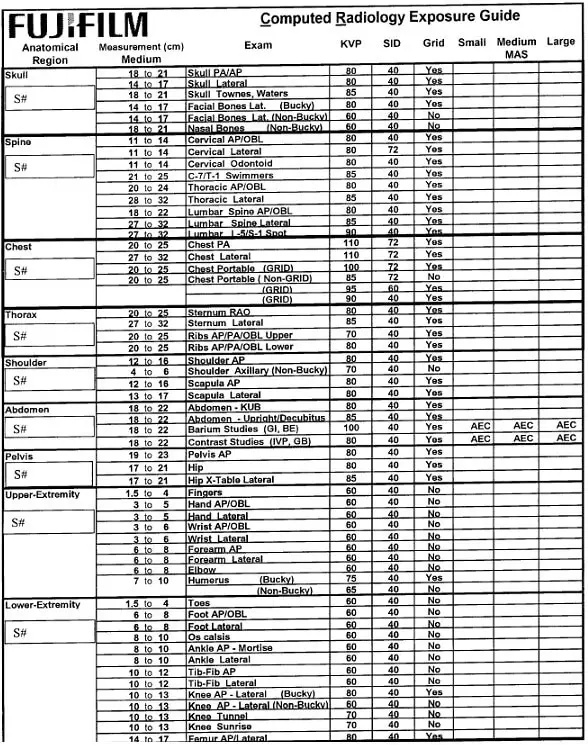
- Body habitus – The chart also contains the size of the patient or body habitus. For instance, it could have indicators for small, medium and large patient body habitus. A large patient will require stronger energy to penetrate the tissue whereas a smaller body type will require less energy. This denotes in the illustration below on the far right columns labeled Small, Medium, and Large.
- Grid use – Grids can place between the patient and the image receptor to reduce the scattered radiation (produced mainly by the Compton effect) and thus improve image contrast. The use of a grid depends on the size of the body part being imaged.
- S# – The Sensitivity number is a value that represents the exposure received by the receptor in the imaging system. It represents key-value monitoring that a quality radiograph is obtained with the least amount of dose to the patient. The value is automatically recorded by the x-ray machine software for every exposure taken. The machine vendors help in establishing what a proper S number should look like on your machine.
What is mAs in radiology?
- It stands for milli-amperes per second
Milliampere-seconds are a measure of radiation produced (milliamperage) given over a set period of time (seconds) from the x-ray machine.
What is kVp in radiology?
- Peak kilovolt or Kilo Volt Peak
Kilovolt Peak or kVp is the technical factor known to control the quality of the x-ray beam produced by the machine. It also controls the contrast or grayscale of the ray image produced. The higher the kVp, the lower the contrast.
What is the 15% Rule in radiography?
- The method of changing the kVp by 15% in either direction, up or down, which causes a doubling or halving of the mAs by 50%.
Effectively, changing the kVp by 15%, either up or down, is the same as doubling or reducing the mAs by 50%, depending on which was you changed the kVp.
What is radiographic contrast?
- The degree of density difference between two areas on a radiographic image.
Have you heard of 50 Shades of Gray?
In radiography, there are up to 65,536 shades of gray in a radiology image produced in radiography or computed tomography (Kimpe 2007).
The monitors, however, that the radiologists use to diagnose the images only go up to 256 shades of gray.
How we post-process those shades determines the level of contrast between densities in the image. Using a chart like this as your chest x-ray technique chart will help determine your diagnostic quality.
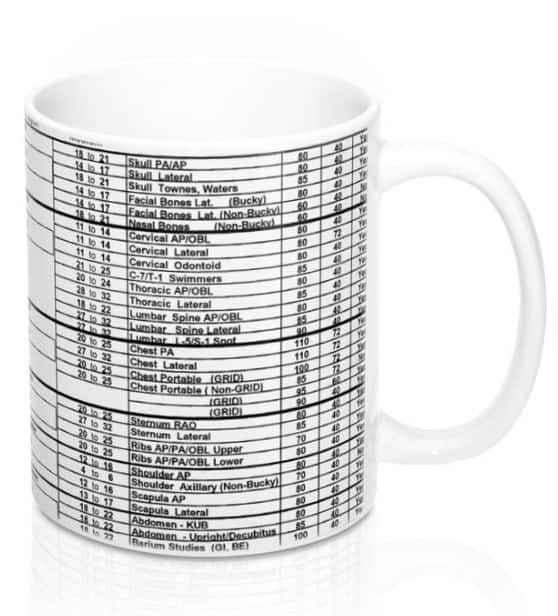
What does an x-ray techniques chart look like?
Here’s an example of a Fuji x ray technique chart:
The history of the x ray techniques chart
Imagine the possibilities and excitement that surfaced when a physics professor back in 1895 realized there was a noninvasive way to see the bones of the human body.
Non-invasive means you don’t have to cut open the body to see inside of it. It all goes back to November 8th, 1895. A physics professor named Wilhelm Conrad Rontgen discovered radiography while working in a darkened room in his laboratory.
He was experimenting with electrical charges flowing through a vacuum tube when a piece of paper coated with barium platinum cyanide began to glow next to him.
By happenstance, it had been left near a cardboard-covered tube. This led him to experiment with the fluorescent paper and the charged tube.
That’s when he discovered that if he held his hand between the cardboard tube and the coated paper, he could see the silhouette of his hand bones on the paper. Eureka!
Moreover, His research showed that x rays could penetrate human tissue. The German professor coined the radiation as unknown at the time. Thus, the value of “X “ in X-ray was born.
Roentgen first used radiography on his wife’s right hand. He used the rays and got a visible picture. He would write down the different technical factors that he used and note the quality of the image produced.
Thus, the technique chart owes its origin to basic experiments.
Moreover, Using this technique of tracking improvements and writing down the change in parameters that lead to better imaging keeps the world of radiology moving forward quickly.
Further, From Wilhelm’s experiments, other radiographers around the world began to use the same techniques. In England, radiography was used in 1896.
A doctor named John Hall-Edwards used it to trace a needle inside a hand. His colleague was pricked by a needle, and it got stuck.
Surprisingly, he was able to get a visual on the foreign body. The medical practice then spread to the United States.
Types of X-Ray Techniques Chart
There are four types of radiography technique charts. The X-ray machine technique charts are used on different types of patients.
You can adjust them according to the client’s condition or history. They include the following;
- Variable kilovoltage
- Fixed kilovoltage
- High kilovoltage
- Automatic exposure controls
Variable Kilovoltage
Fixed Kilovoltage (shown a fixed kVp technique chart)
High Kilovoltage
Automatic Exposure Controls (AEC)
Computed Vs Digital Radiography

How to use an x ray techniques chart
Benefits of using the x ray techniques chart
1. Top-notch images
2. Time-efficient
3. Suitable for busy clinics
4. Flexible

The chart is versatile for all patients, equipment, and environments. They could be used with pediatric or geriatric patients. You can adjust the settings to suit the patient’s needs in a doctor’s clinic or busy hospital environment. This also translates to higher patient safety due to reduced repeat exams.
5. Easy usage
Conclusion
- General x ray technique chart
- Chest x ray technique chart
- Abdomen x ray technique chart
- Fixed kVp technique chart
- Computed radiography technique chart
- Radiography technique chart
- kVp and mAs technique chart
- digital radiographic technique chart
- pediatric x ray technique chart
- Fuji CR technique chart